Key Takeaways
In the article’s frozen snack example, slotting accounts for 59.7% of a $135,600 operating loss, which makes most of that loss a one-time growth cost.
Four checks reveal how much of a loss is growth spending, and the first is contribution margin per unit for every SKU you sell.
The example’s variety pack sells well and still loses $0.21 on every unit, and trimming its trade rate to 18% turns that into a $0.39 gain.
At 3 units per store per week, the $81,000 slotting check takes 2.8 years to pay back, and at 5 units per store per week payback falls to 20.2 months.
SBA 7(a) Small Loans require a debt service coverage ratio of at least 1.10, and lenders can test it on 12-month projections, so a brand with a loss can still meet the bar, as the example brand does at 1.17.
Picture a frozen snack brand closing a year on $3,200,000 of gross wholesale sales with a $135,600 operating loss. Its Founder wrote an $81,000 slotting check to open a new 180-store regional chain. Next month, a working capital conversation with the bank lands on the calendar. Every Founder in that seat wants to know how the loss will look across the table. Your CPG unit economics hold the answer, and you can read them yourself first.
I’m Pedro Noyola, CEO and Founder of Cultivar, and I mentor Founders in the SKU accelerator and through TIG Collective. I also invest in CPG brands with The Angel Group, so I know how a loss reads in the investor’s chair.
My view is that a growing brand’s loss usually stacks two numbers together. The first is a one-time growth cost, and the second is the recurring result, which is the profit or loss the business makes each year once fixed overhead is paid. Lenders and investors back the Founder who can pull those two apart with math. Four checks get you there, and they are SKU contribution margin, the one-time share of the loss, slotting payback, and debt service coverage.
Our frozen snack brand sells a core bag at $4.00 wholesale and a variety pack at $6.00. It carries $668,000 in fixed overhead for the year. Fixed overhead covers costs that stay level as units change, like salaries, rent, insurance, and software. The new chain will stock the core bag only, and none of this year’s sales figures count the chain’s orders. Every figure is illustrative, so swap in your own numbers as we go.
Can a CPG Brand That’s Losing Money Still Get a Loan or Investment?
Yes, a CPG brand that’s losing money can still get a loan or an equity investment. The numbers have to show the loss is growth spending on healthy unit economics.
Loans get paid back with interest on a set schedule. Equity buys an investor a share of ownership in your company. SBA lending rules say loans must be so sound as to reasonably assure repayment. SBA lenders reading an unprofitable CPG brand’s file therefore test that cash flow covers the payments on all business debt. Investors look for proof that more capital turns the loss into profit.
How Do I Know If My CPG Unit Economics Are Broken?
Your CPG unit economics are broken when a SKU’s contribution margin per unit falls below zero. At that point, every extra unit you sell adds to the loss. Unit economics are the revenue a unit brings in minus the costs of making and selling it. Contribution margin is the amount by which your selling price exceeds your variable cost per unit, and it goes toward fixed costs first, with whatever is left becoming profit.
MIT Sloan Management Review sets out a clean test for when losing money is strategic, built on price and avoidable costs. Avoidable costs are the costs that disappear when you stop selling that unit. When your price sits above those costs, larger volumes will likely lead to profit, and when it sits below them, even high revenue usually comes with high losses. That one test settles the good losses vs bad losses question, and I’d hand it to any Founder sitting on a loss.
| Net revenue per unit |
|---|
= Wholesale price − Trade spend per unit |
| Contribution margin per unit |
= Net revenue per unit − COGS per unit − Freight and distributor fees per unit |
| Line item | Core bag | Variety pack |
|---|---|---|
| Wholesale price | $4.00 | $6.00 |
| Trade spend | −$0.68 (17%) | −$1.68 (28%) |
| Net revenue | $3.32 | $4.32 |
| COGS | −$1.82 | −$3.46 |
| Freight and distributor fees | −$0.47 | −$1.07 |
| Contribution margin per unit | $1.03 | −$0.21 |
| Units sold this year | 620,000 | 120,000 |
| Annual contribution | $638,600 | −$25,200 |
I love this table because it shows the variety pack, a strong seller, losing $0.21 on every unit it sells, and once a loss is that visible, one change to trade spend can turn it into a profit.
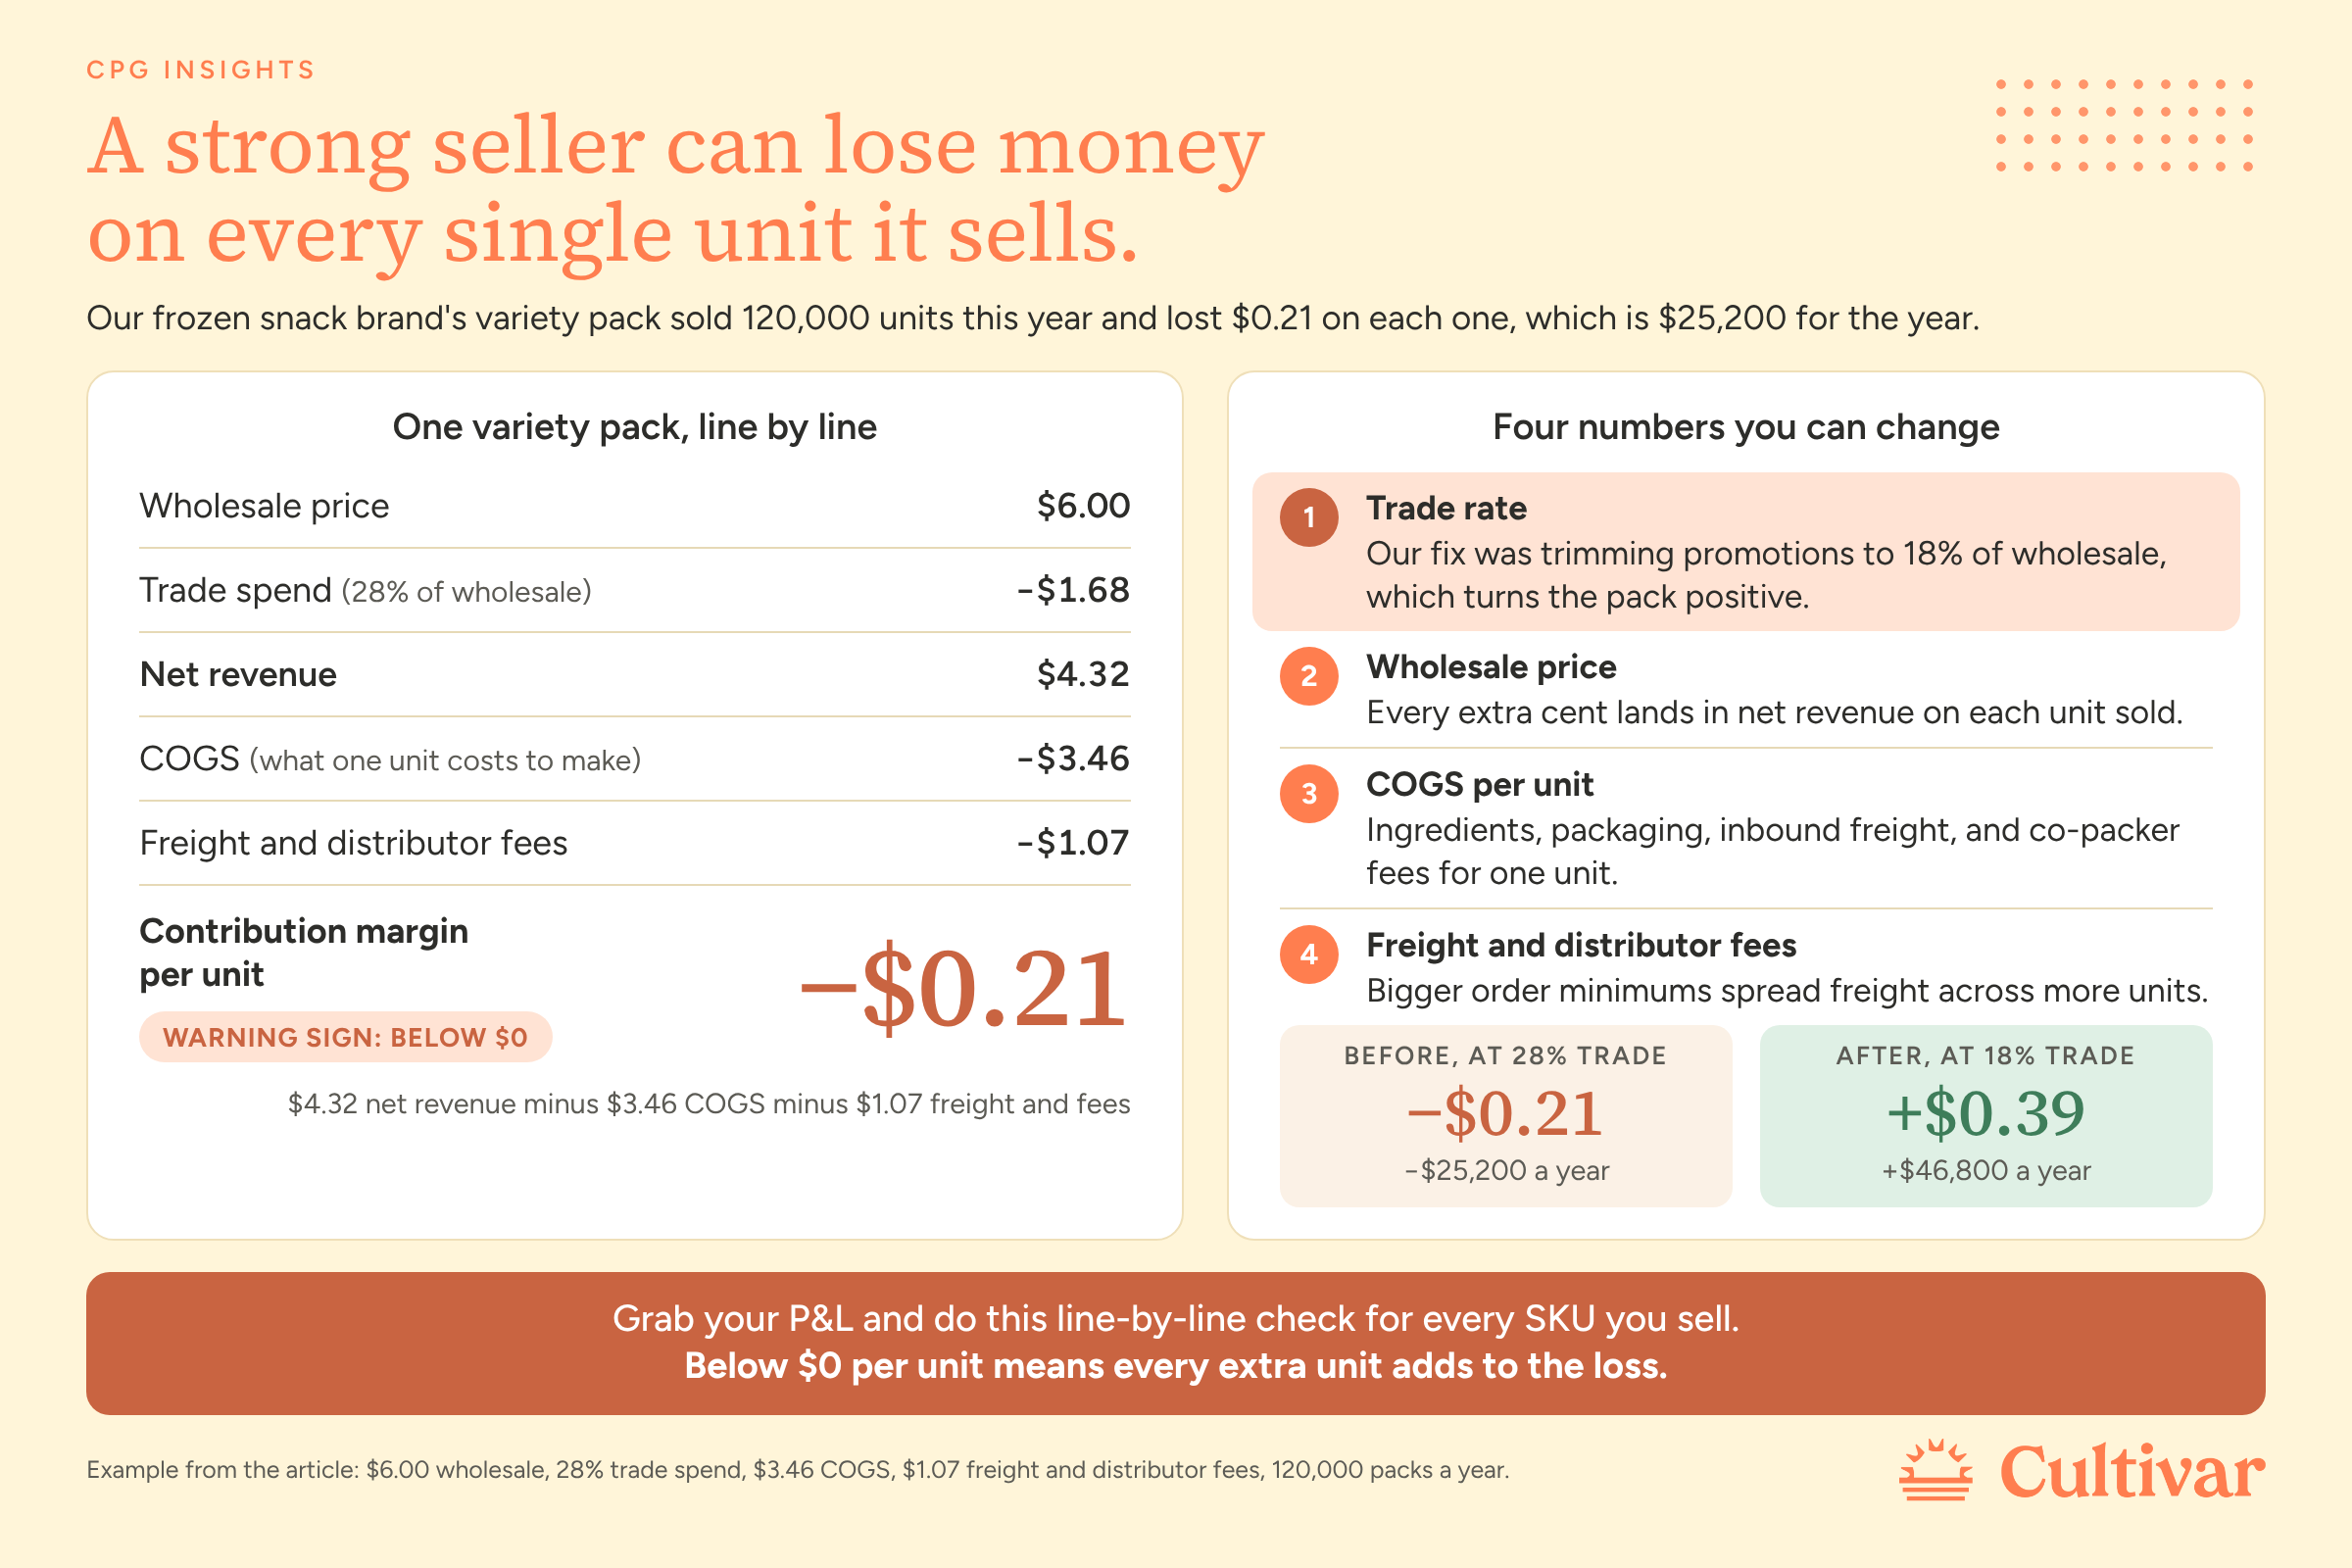
Pin this beside your monthly P&L and spot a SKU that loses money on every unit within a month.
How Much of My CPG Brand’s Loss Is One-Time Growth Spending?
The one-time share of your loss is the slotting and other launch costs that belong to this year alone, and for our brand that’s 59.7% of the loss. Slotting is a lump-sum, up-front payment so a retailer will carry a new product and place it on its shelves.
Take the $81,000 of slotting out, and the recurring result is a $54,600 loss.
Turning the Recurring Loss Into a Profit
I go deeper on how to calculate breakeven for a CPG company in another post, and the formula fits in one box.
| Break-even volume |
|---|
= Fixed costs ÷ Contribution margin per unit |
Our core bag has to cover the variety pack’s loss on top of the overhead. Together that comes to $693,200, which is the $668,000 of overhead plus the pack’s $25,200 loss. Divide $693,200 by the bag’s $1.03, and break-even comes to 673,010 bags against the 620,000 the brand sold.
Next, trim the variety pack’s promotions to 18% trade, or $1.08 a pack. Net revenue rises to $4.92 per pack. The CPG contribution margin on the pack flips to positive $0.39, which is $4.92 minus $3.46 minus $1.07. The pack now adds $46,800 a year, a $72,000 swing on the same 120,000 packs.
Break-even falls to 603,107 bags, calculated as $668,000 minus the pack’s $46,800, divided by $1.03. The brand already sells 620,000 bags, so the recurring result becomes a $17,400 profit. Y’all, I get stoked watching a break-even line slide under the volume a brand already sells. Our example assumes the pack still sells 120,000 units at the lower trade rate. Test that assumption with your own retailer data before you count on it.
How Do Investors Judge a CPG Brand That Isn’t Profitable Yet?
Investors judge a pre-profit CPG brand on velocity and a clear path to profitability. I always tell Founders to focus on velocity, and I’ve called it the number one metric that shows investors you have something worth scaling.
Velocity is the number of units sold per store per week. Payback is the time it takes to recover an investment through the cash it generates. Your CPG unit economics connect the two, because each extra unit of velocity pulls slotting fee payback closer.
| Slotting payback |
|---|
= Slotting cost ÷ Annual contribution of the new stores |
At 3 units per store per week, the new chain sells 28,080 bags a year, which is 180 stores times 3 units times 52 weeks. Each bag contributes $1.03, so the chain adds $28,922.40 a year. Payback on the $81,000 check comes to 2.8 years, or 33.6 months.
Pair that timeline with a three-statement model, which links your income statement, balance sheet, and cash flow statement. Cultivar created Pistakio’s three-statement financial model to give Co-Founder Nico Buffo visibility into runway, growth targets, and fundraising needs, and we coached him to speak the language of investors.
What Debt Service Coverage Ratio Do Lenders Want When Your Brand Is Losing Money?
SBA 7(a) Small Loans, the SBA’s loans of $350,000 or less, require a debt service coverage ratio of at least 1.10 to 1. Under the SBA’s notice effective March 1, 2026, lenders can test the SBA 7(a) Small Loan coverage minimum on a historical or projected basis, so brands that are losing money can meet it with 12-month projections and supporting assumptions that show the coverage within one year of loan funding. The SBA debt service coverage ratio divides operating cash flow by the future required principal and interest payments on all business debt, including the new SBA loan.
| Debt service coverage ratio |
|---|
= Operating cash flow ÷ Annual principal and interest on all business debt |
I’m simplifying operating cash flow to contribution minus fixed overhead. The SBA defines operating cash flow as earnings before interest, taxes, depreciation, and amortization, and your lender can make the adjustments the SBA’s rules allow. The trailing year’s negative $135,600 fails the historical test, so the projection carries the file. Assume no new slotting checks and no debt beyond the new loan, and the next 12 months look like this.
| Projected next 12 months | Amount |
|---|---|
| Recurring result after the variety pack fix | $17,400.00 |
| New chain contribution at 3 units per store per week | $28,922.40 |
| Projected operating cash flow | $46,322.40 |
| Payments on an illustrative $150,000 five-year loan at 11.5% | About $39,600 |
| Debt service coverage ratio | 1.17 |
Build that 12-month projection with the same care as your historical books, and our loan support for CPG brands can help.
Should You Talk to a Lender or an Investor About Your Loss?
Talk to a lender when every SKU carries a positive contribution margin and projected cash flow covers loan payments at least 1.10 times. Talk to investors when the loss is growth spending with a payback timeline they can see.
Together, these four checks put margin, trade spend, cash flow, and lender prep into one conversation. Your one action this week is to calculate contribution margin per unit for every SKU you sell.
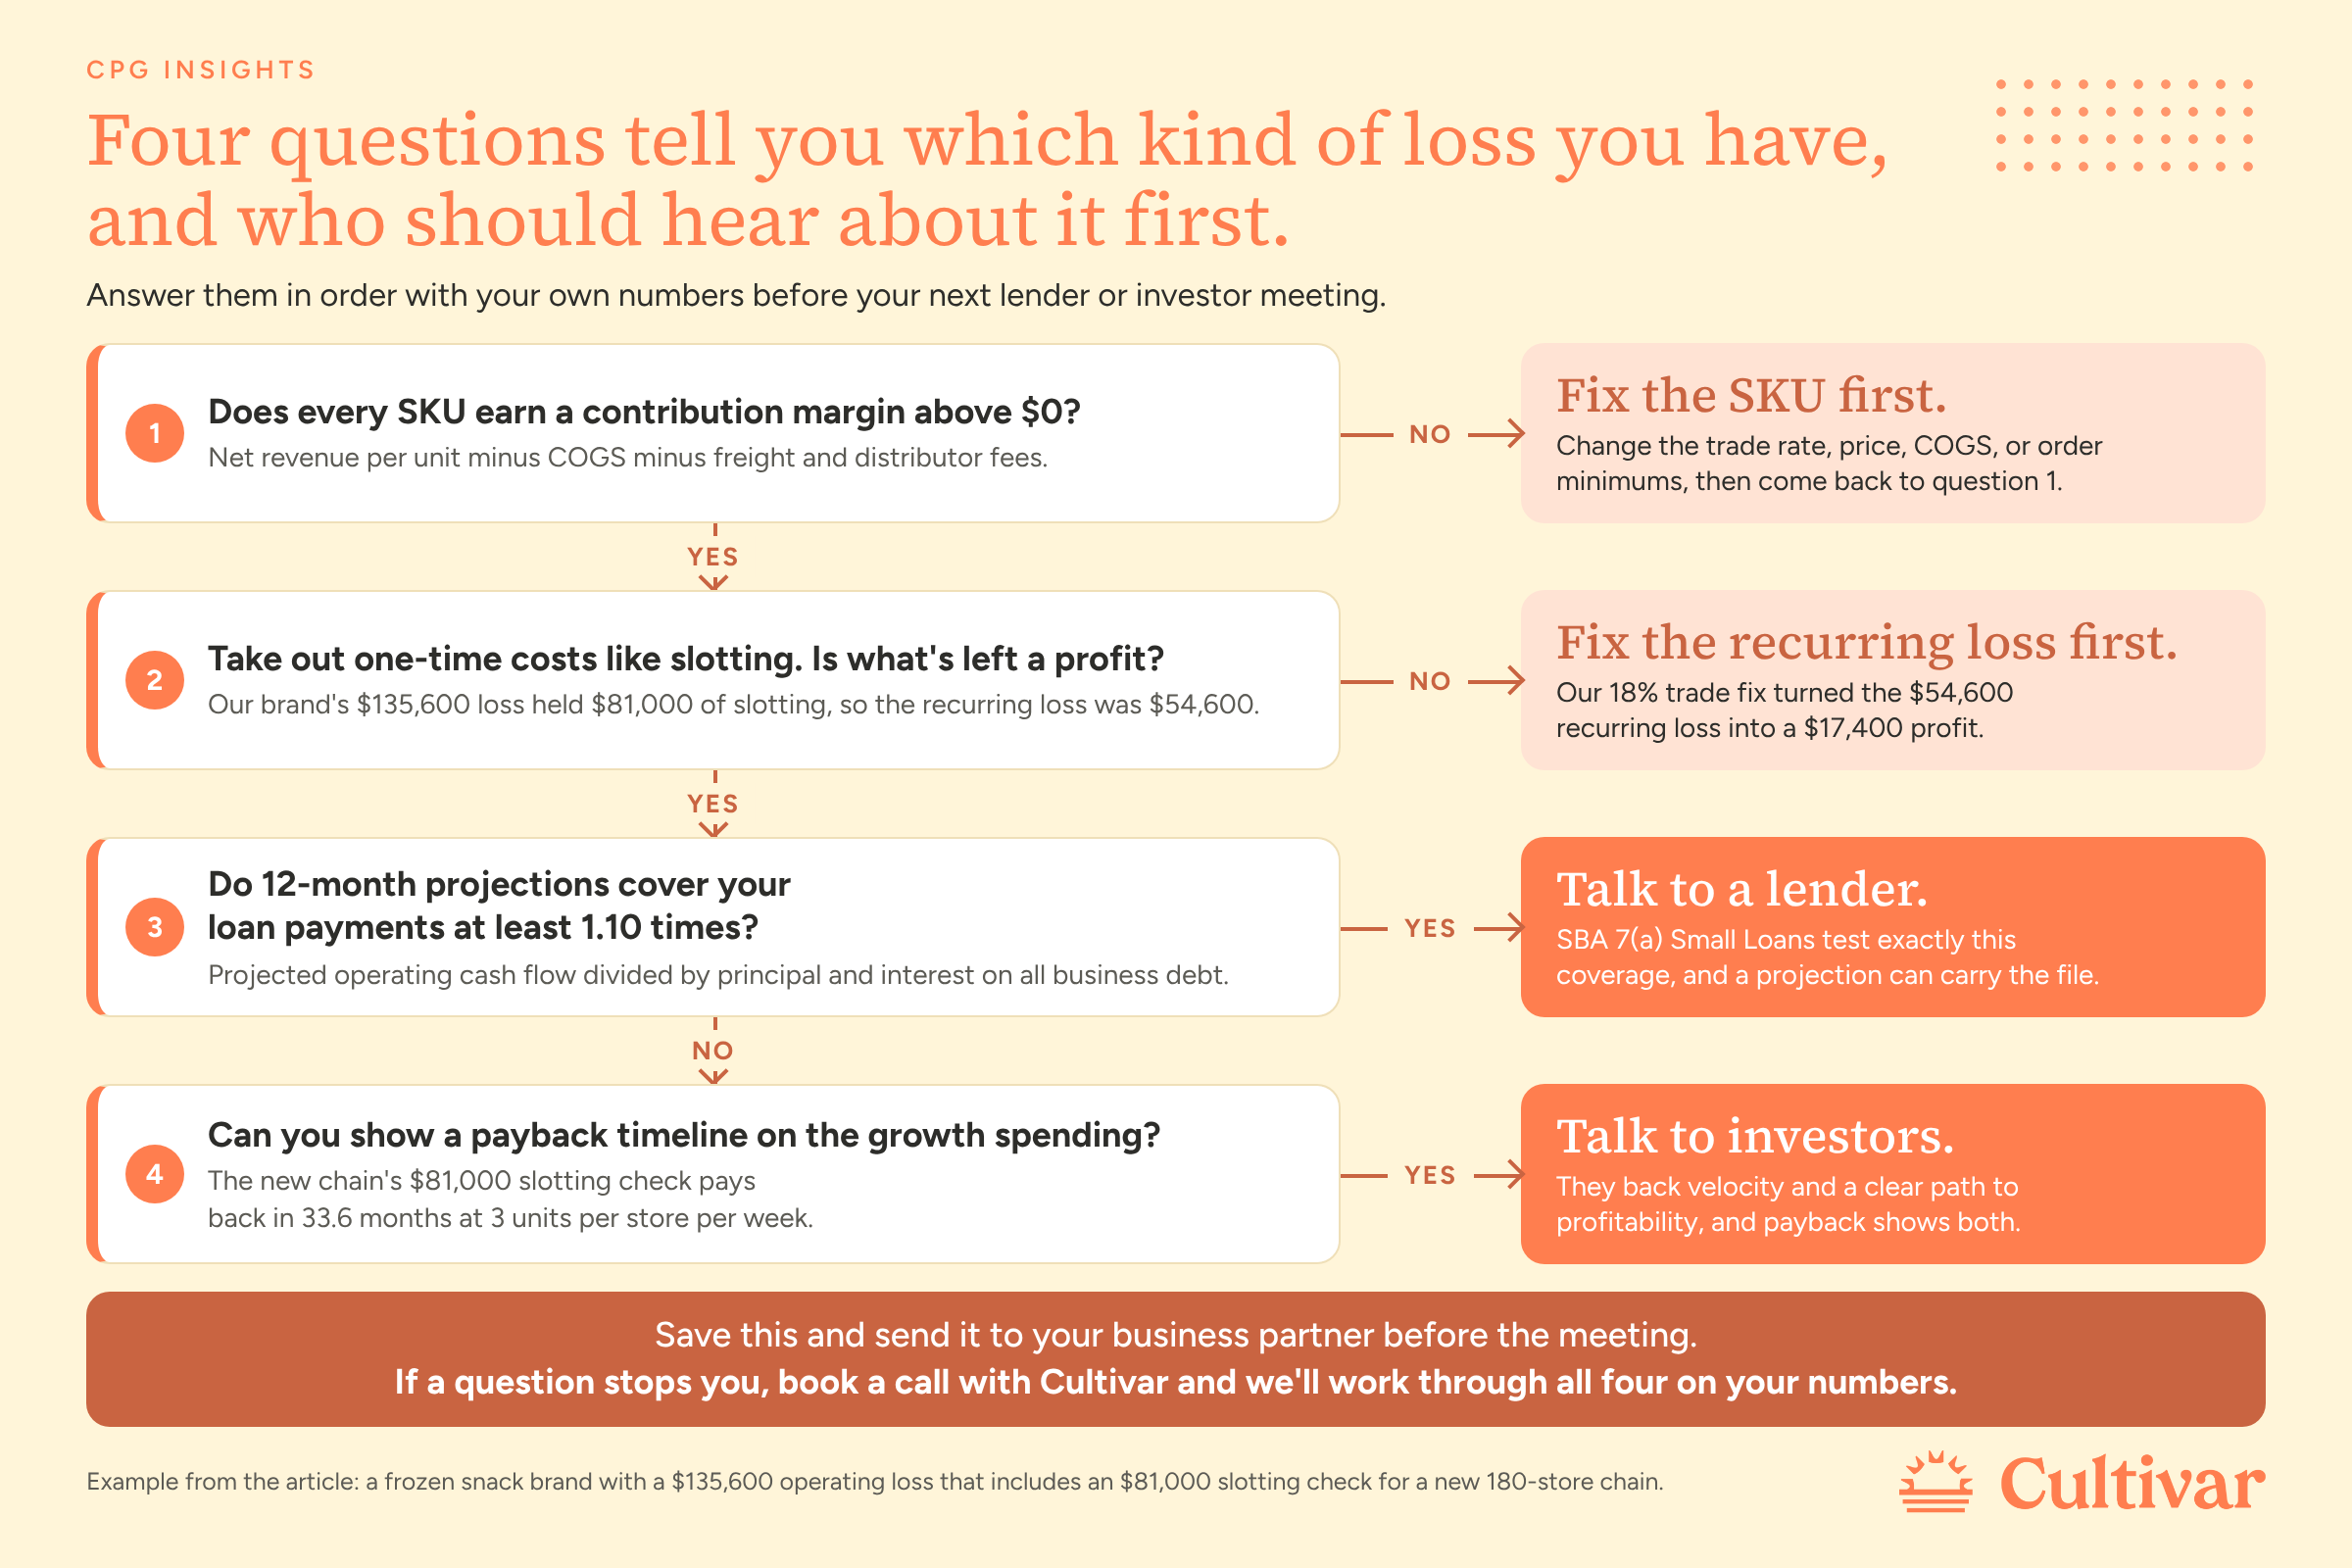
Save this and send it to your business partner before your next lender or investor meeting.
If your P&L shows a loss and a lender or investor meeting is on the calendar, book a call with my team at Cultivar, and we’ll work through these four checks on your numbers together.
Frequently Asked Questions
Can I Get an SBA Loan If My Business Had a Net Loss Last Year?
Yes, you can still get an SBA loan even if your business had a net loss last year. An SBA 7(a) Small Loan can rely on 12-month projections, with supporting assumptions, that show coverage of at least 1.10 to 1 within one year of loan funding. I’d ask your lender early if a projection can count for your file.
What Is a Good Contribution Margin for a Frozen Food Brand?
A good contribution margin for a frozen food brand selling through retail is about 25% to 35% of its wholesale price. Published frozen-only figures are scarce, so I rely on the national retail range in Endless Commerce’s guide to contribution margin by channel. Our core bag lands inside that range at 26% of its $4.00 wholesale price, or $1.03 a bag.
Should I Drop a SKU That Loses Money on Every Unit?
I’d fix a SKU that loses money on every unit before dropping it, starting with its price, trade rate, freight, or order minimums. Trimming our variety pack’s trade to 18% turned a $0.21 loss per unit into a $0.39 gain at the same $6.00 wholesale price.
How Do Angel Investors Evaluate a Food Brand That Isn’t Profitable?
Angel investors evaluate a food brand that isn’t profitable by looking at its velocity and its clear path to profitability. In our example, payback shrinks to 20.2 months at 5 units per store per week, 13.4 months sooner than at 3 units.
Related Resources
What investors look for explains why velocity is the number one metric investors watch and how to show a clear path to profitability.
Cultivar’s accounting for CPG brands delivers monthly closes and CPG-specific financial reports that are presentation-ready for funding rounds.
¡Ya Oaxaca! scenario planning shows how Cultivar rebuilt a three-statement financial model so Co-Founder and President Azul Couzens could see the impact of equity raises and organic expansion in real time.