Say it’s a Saturday morning, and you’re working magic at a grocery store demo table. Shoppers are crowding around your samples, the tray empties twice, someone tells you it's the best thing they've tasted all year, and you drive home sure the day was a win. Busy feels like winning, but the metric that tells you if it actually worked is a lot quieter. How many tasters put a unit in their cart? Founders who track trade spend ROI have to ask that quieter question about every promotion they fund.
I'm Pedro, CEO of Cultivar, where my team does the financial operations for food and beverage brands, and I mentor Founders through SKU, a CPG accelerator. I've sat beside enough Founders staring at a promotion that crushed it on volume and somehow shrank the bank balance that I now bring the formula below into every one of those conversations.
What Trade Spend ROI Actually Measures (and Why Most Founders Never See It)
Trade spend ROI measures the gross profit a promotion created on top of what you would have earned anyway, set against everything the promotion cost you. Most Founders never see the ROI because the report a retailer or distributor sends stops at units sold during the window, and the two numbers that decide profit are missing.
| The two units a promotion report never shows you |
|---|
| Subsidized units are the ones shoppers would have bought at full price, which you discounted anyway. |
| Pulled-forward units are the ones shoppers stocked up on, which they'll skip next month. |
The stakes reach past this quarter, too, because trade spend can hurt your exit when a buyer sees velocity propped up by discounts.
Track Trade Spend ROI With a Formula You Can Use Right Now
Two lines of arithmetic are the whole method, and you can apply them to last quarter's promotions this week.
| Trade Spend ROI (%) |
|---|
= [(Incremental Gross Profit − Total Trade Spend) ÷ Total Trade Spend] × 100 |
| Incremental Gross Profit |
= (Promotion Units − Baseline Units) × Regular Margin per Unit |
Measure incremental gross profit at your regular margin, before the discount, so the trade spend gets counted only once. Here's a worked example with illustrative numbers. Your brand sells 400 units a week at $6.00 to the retailer, with a $3.60 cost per unit and a $2.40 margin. You approve a four-week off-invoice promotion at $1.50 off per unit, and weekly volume jumps to 900 units. Assume the retailer orders exactly what it sells, so units shipped and units scanned match.
| Line | Math | Result |
|---|---|---|
| Units sold during the promotion | 900 × 4 | 3,600 |
| Baseline units, same four weeks | 400 × 4 | 1,600 |
| Incremental units | 3,600 − 1,600 | 2,000 |
| Incremental gross profit | 2,000 × $2.40 | $4,800 |
| Total trade spend | $1.50 × 3,600 | $5,400 |
| Trade spend ROI | ($4,800 − $5,400) ÷ $5,400 | −11.1% |
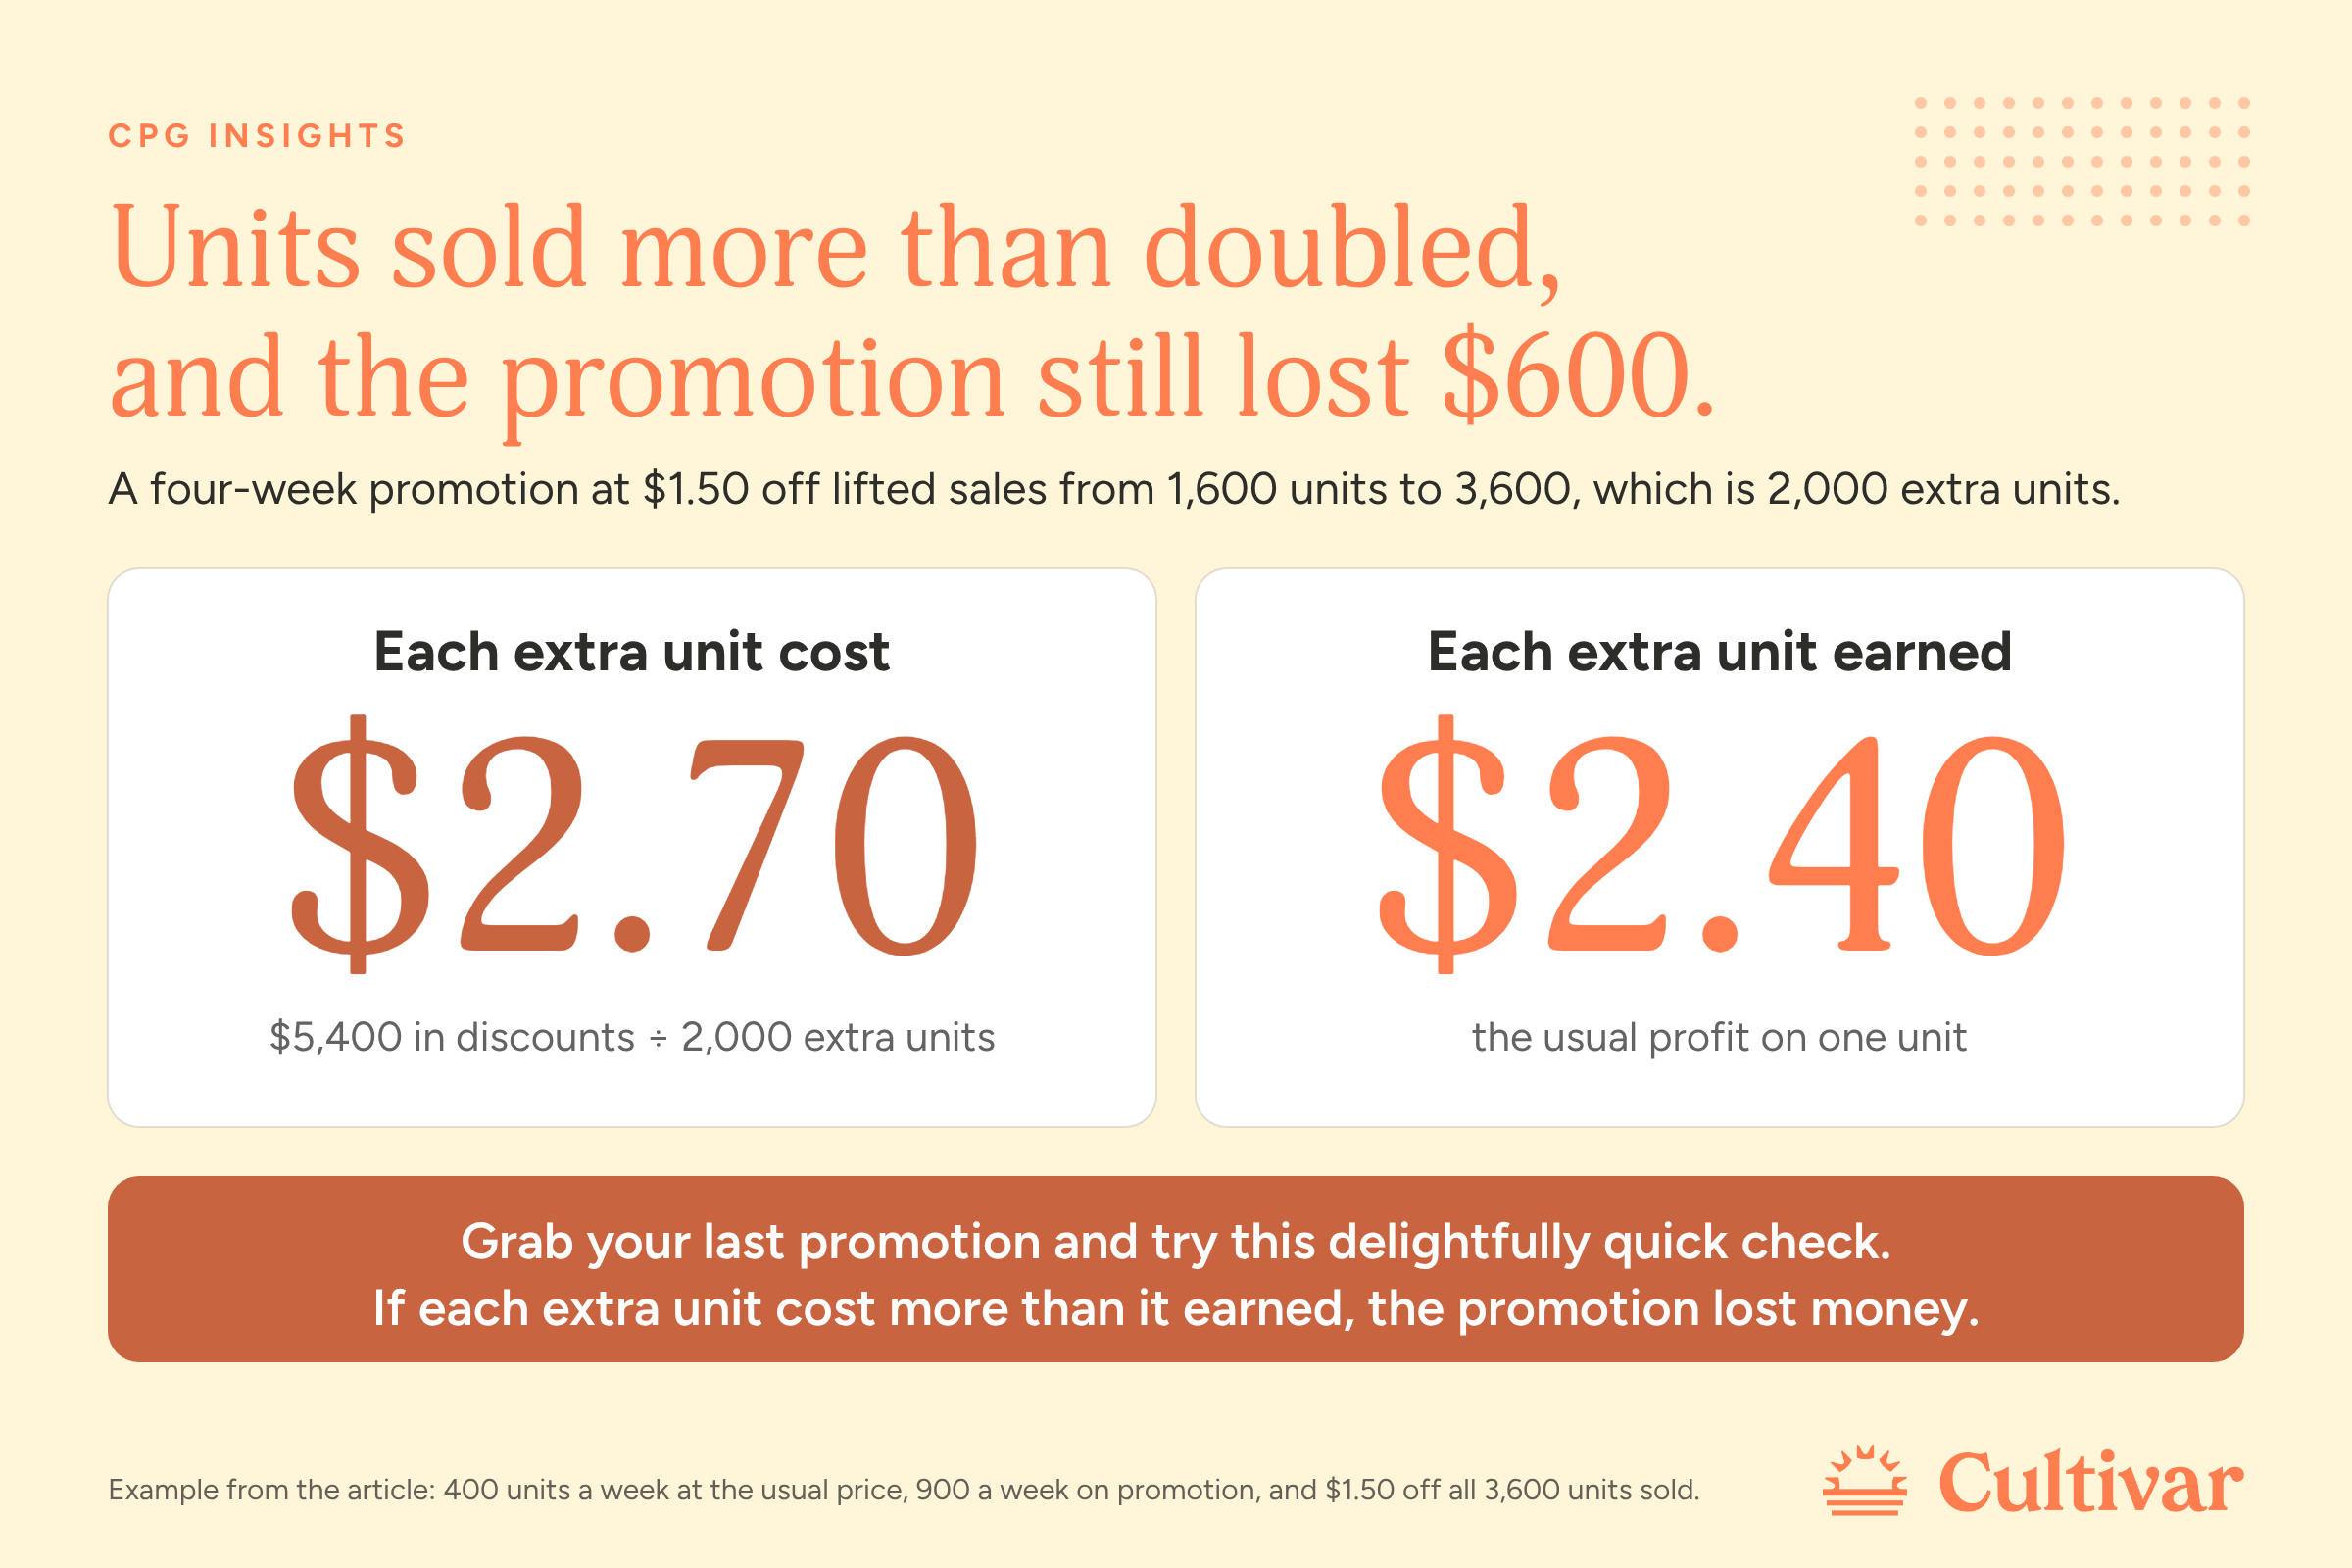
Volume more than doubled, and the promotion still lost $600. Here's the detail that makes me want to grab a whiteboard marker. You paid $1.50 on 1,600 units shoppers would have bought anyway, which is $2,400 of discount on sales you already had. The shelf cleared, and so did a chunk of your margin.
Two Shortcuts That Flag a Losing Promotion in 30 Seconds
Cost per incremental unit is trade spend divided by incremental units, $5,400 ÷ 2,000 = $2.70, and each of those units only earns $2.40. Any promotion that costs more per incremental unit than your margin per unit has lost money before you open the ROI formula.
Breakeven lift is the volume increase a discount needs just to pay for itself, and you find it by dividing the discount by the margin left after the discount. Here that's $1.50 ÷ $0.90, or 167%. The shortcut covers per-unit discounts, so add any flat fee to trade spend and use the full formula. Your promotion posted 125% lift, which sounds like a parade and still fell 42 points short. By the time the discount per unit reaches your margin per unit, no amount of lift can rescue it, and that's the sentence I'd print on every promo calendar if the printer allowed it.
The Trade Spend Metrics Worth Watching Beyond ROI
ROI tells you if a promotion paid off, and these five trade spend metrics tell you why, so you can fix the cause instead of killing the event.
Baseline Volume
Baseline volume is what a SKU, meaning a single product, sells at its regular price. Average the eight non-promoted weeks before the event and leave out holiday weeks, or your baseline will be wrong before the promotion starts. Write it down before the event, because baselines reconstructed afterward drift toward whatever makes the event look good.
Subsidized Volume Share
Subsidized volume share is the slice of promoted units you would have sold anyway. In the example, 1,600 of 3,600 units, or 44%, were full-price sales you discounted, and every point you shave off this share is margin back in your pocket.
Post-Promotion Dip
Post-promotion dip is what happens in the weeks after the event ends. Say sales drop to 300 a week for two weeks instead of 400. Those 200 missing units were pulled forward by shoppers who stocked up, so true incremental volume falls to 1,800, incremental gross profit to $4,320, and ROI to −20%. University of Groningen professor Peter Leeflang co-authored a 2004 Marketing Science study that decomposed promotion bumps across four store-level scanner datasets and found that sales borrowed out of other weeks, sales taken off competing brands, and category expansion each contributed about a third on average.
Cannibalization
Cannibalization is the volume your promoted SKU borrows out of your other flavors. Watch the whole line, because one SKU jumping to 900 units a week while its sibling falls to 150, both having started at 400, means half the lift came off your own shelf, and the trade dollars behind those 250 units bought you nothing new. USDA's Economic Research Service also found that retailers time private label discounts to counter national brand promotions, most strongly in processed, storable categories, which describes most snack and beverage aisles.
Pass-Through
Pass-through is how much of your discount reached the shelf price. Kellogg School professor David Besanko co-authored a 2005 study that measured it across 11 categories at one Chicago supermarket chain and found rates ranging between 22 cents on the dollar for toothpaste and more than the full dollar for beer, with three-quarters of the variation sitting between products inside a single category. Your SKU's number only shows up in your own data, so log the shelf price during every window.
Watching those five together is what measuring trade promotion effectiveness really requires, and it's the core of solid trade spend management.
Tools Built to Track Trade Spend ROI
The tool most Founders already own is a spreadsheet with one row per promotion, and it does this job for longer than you'd expect. Give it columns for dates, retailer, SKU, baseline units, promoted units, post-promotion units, regular margin, discount per unit, fees, and the shelf price you observed, and the formula does the rest. You've outgrown it the day you can't name last quarter's worst-performing promotion within a minute of being asked.
Two platforms show the range, and I'm naming them strictly as examples to evaluate. Vividly says its typical customer plans 500 to 25,000 promotions a year and lists an ROI analysis feature built to "understand how your promotions performed." Floret pairs deduction management with trade spend insights "by month, UPC, retailer, and category," says it's built for brands of all sizes, and offers a free pilot. Neither publishes pricing, and both descriptions appear on the companies' own websites as of October 2026, so check where your own promotion count sits before you book a demo.
Our take on why software alone won't protect margins explains what the tool leaves for a person to do. If you'd like a team tracking deductions and trade accruals alongside your forecast, that's the work Cultivar's trade spend management service takes on.
Building a Habit That Reduces Trade Spend Waste
Score every promotion two weeks after it ends, once the post-promotion weeks are in the data, using the trade spend you agreed to, and update the score when the final deductions arrive. Give each one a continue, shrink, retest, or kill decision while the buyer conversation is still fresh.
Shrink Before You Kill
Depth is the lever most Founders never touch, because the buyer asked for $1.50 and $1.50 went on the calendar.
| Scenario | Discount | Breakeven lift | Actual lift | Trade spend | ROI |
|---|---|---|---|---|---|
| Original | $1.50 | 167% | 125% | $5,400 | −11% |
| Shallower, same lift | $1.00 | 71% | 125% | $3,600 | +33% |
| Shallower, softer lift | $1.00 | 71% | 80% | $2,880 | +7% |
Lift will probably soften at the shallower discount, and the third row shows the promotion clearing breakeven anyway.
Four Rules That Make the Scorecard Stick
Rank the period's promotions by cost per incremental unit, worst at the top.
Retest a loser once, at a single retailer, before you cut it for good, because one bad week can produce one bad result.
Set a standing rule that no promotion with two negative scores gets a third outing at the same depth.
Sales and finance gotta read the same scorecard, because two spreadsheets that disagree are how waste survives another quarter.
That habit is how brands reduce trade spend waste and optimize trade promotion spend over time.
Put a Number on Every Trade Dollar
Any Founder with a spreadsheet can track trade spend ROI, and the confidence that comes with it is the real prize. You walk into the next buyer meeting knowing which depth, which retailer, and which month pay for themselves, and the same measured dollars show up in your margin, your cash forecast, and the deck you hand a lender or investor. For proof of what disciplined numbers do for a real CPG food brand, see how Alec's Ice Cream partnered with Cultivar.
I get stoked about this stuff. Bring your ganas and last quarter's promotion list, and we'll apply the formula to it together. Schedule a call with Cultivar.
Frequently Asked Questions About Tracking Trade Spend
How Do You Calculate Trade Spend ROI?
Take incremental gross profit, subtract total trade spend, divide the result by total trade spend, and multiply by 100, measuring incremental profit at your regular margin.
What Percentage of Trade Spend Is Wasted?
It varies by brand, so measure your own subsidized volume share first. In the example above, 44% of the discounted units were sales you would have made at full price.
What Is a Good ROI for a Trade Promotion?
Any positive ROI means the promotion earned back more gross profit than it cost. The useful comparison is across your own promotions, which shows which discount depth, retailer, duration, and time of year to repeat.
How Do I Track Trade Spend Without Buying Software?
Use one spreadsheet listing each promotion's dates, baseline units, promoted units, post-promotion units, regular margin, and trade spend, then apply the formula after every event.
Related Resources
Financial planning and forecasting connects trade spend tracking to the forecasting you'll need once trade dollars are measured.
Financial KPIs for emerging CPG brands covers gross margin, contribution margin, velocity, inventory days on hand, and cash conversion cycle.
CPG sauce brand's cash conversion cycle shows how one brand's cycle was projected to shrink to under 100 days, starting at 139.